Mirador Real Advice Blog
So If Bond Analysts Are So Smart, What Else Can We Learn From Them?
August 22, 2024
In my last blog post regarding the yield curve, I talked about how huge and important the bond market is and how I believed this results in it attracting a higher level of thought and analysis relative to the stock market.
Okay so you might ask, Stan, if you think bond analysts and the bond market is so great, why aren’t you running a bond fund? The answer is easy. I could, and I would do it well, but the difference between good bond analysis and a not so good analysis is fractions of a percent. In dollar values, it is negligible unless you manage billions. And I don’t manage billions. So I have learned to use bond brains to draw better results from combined stock and fixed income portfolio management.
This all begs the question, how else should we be drawing on this perceived better level of analysis that the debt analysts seem to have? One place is what is known as credit spreads. A credit spread is the difference between the yields of bonds of lower quality ratings versus a well known government benchmark bond or bond index.
So at the risk of sounding Einstein-ish, let’s talk about how relativity applies to the investment world. To make markets trackable or measurable, the industry has developed indexes. Using the Bloomberg Professional Terminal, I have access to thousands of indexes. Also to help follow the markets, some asset groups – especially bonds, have specific benchmark securities. The U.S. 10 Year Treasury Bond is likely the most popular bond benchmark in the world. Currently, the actual bond for this benchmark is the 4 3/8 coupon Treasury Bond maturing May 15th of 2034, and its current yield to maturity is 3.95%. There are similar bonds with different maturities that serve as benchmarks for most terms to maturity between 1 month and 30 years, as you saw in the Yield Curve Blog Post recently. These all represent what the overall bond market is doing.
All other bonds are priced relative to these U.S. Treasury Bond benchmarks. All bonds’ price and yields are determined by the bond traders’ perception of each bonds risk, relative to the benchmark. A 10 year bond for a corporation with slightly more risk than the U.S. government might trade at a price to provide a slightly higher yield like 4.5%. A company with a fair amount of risk like an upstart airline might trade at a price to yield double that of the benchmark – probably over 10 percent.
There are also indexes of bonds and these indexes have a yield based on their components. Different index yields can be followed and compared to get a sense of what is happening in the overall bond market and the various subgroups of the overall bond market.

For example, we use the iShares Core Canadian Universe Bond Index ETF as the fixed income benchmark component for our Canadian Triopay program and the AGG iShares Core U.S. Aggregate Bond ETF for our U.S. Triopay program. Both these indexes have a large number of bonds from different types of government and corporate issuers. There are also junk bond indexes like iShares iBoxx High Yield Corporate Bond ETF that can be very helpful when their change in yields relative to the government bond benchmarks or the AGG index are tracked. We evaluate their yields relative to the government bond benchmarks and other indexes to ascertain the analysts’ views of the future economic and corporate environment. This is one of the best uses of credit spreads and relative analysis in the investment management world.
The bond traders do extensive government and company analysis to determine their perception of a organization’s risk and the risk of its bonds. This would include factors such as:
- The amount of debt the organization has relative to its share equity
- The profitability of the organization
- How much cash flow there is to cover interest expenses
- The prospects within the company’s industry
- Competitive factors
- Economic Factors
When analysts get concerned about the economic future, one main concern is the profitability of companies, which in turn affects their ability to pay interest on their bonds or even repay the bondholders at maturity. So when the smart bond money people think the economy and corporate profit environment are deteriorating, they are willing to pay less for corporate bonds, driving their prices down and their yields up. When this happens on a broad basis, we see the yield of the corporate bond indexes increasing. If the government bond yield stays around the same or only increases slightly, the credit spread increases – the difference between corporate bond yields and government bond yields gets greater. This is a good clue about the future of the economy that is driven largely by corporate profitability. The spreads change when the smart money views change.
Other charts I monitor are indexes of credit spreads. When lower quality corporate yields increase at a greater rate than government benchmark yields, the index rises, and vice versa. Below is one such index called the CSI BARC Index which is calculated by taking the yield of the Barclays Capital US Corporate High Yield Index minus the US Generic Government 10 Year Yield. A recent picture of the index from the Bloomberg Professional Terminal follows:
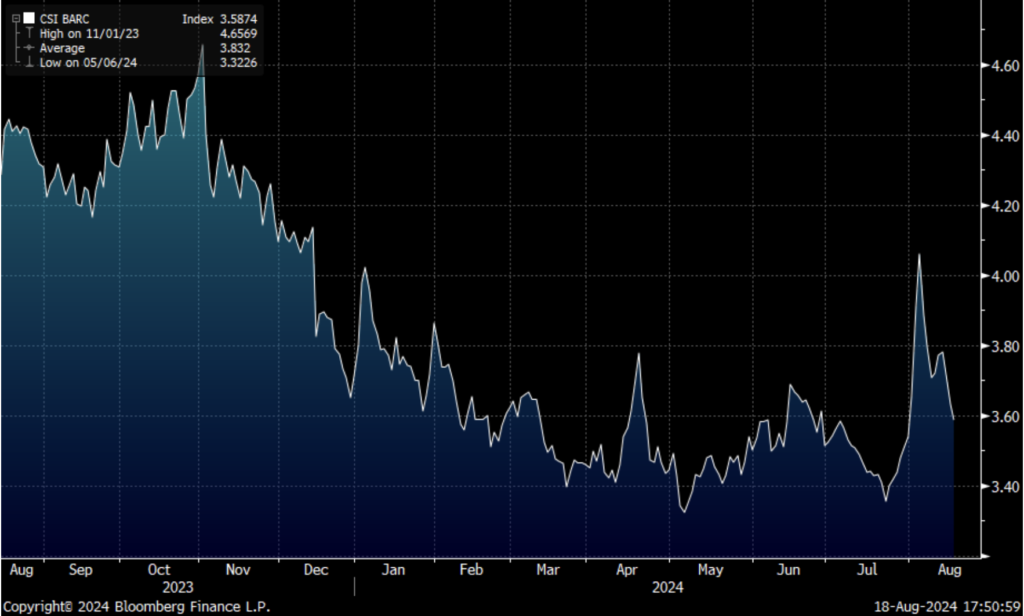
Notice how it has been declining overall for almost a year. And then when there was that awful day in the markets on Monday, August 5th 2024, it spiked upwards greatly, indicating corporate results and economic concerns. This led Mirador to hedge our Equity Income exposure. Then when this chart retreated greatly, confirming the stock index recovery, we converted the hedges to leveraged long ETFs.
In previous blog posts, I talked about my history in the bond market. In the early nineties, I only managed government bond portfolios. As yields declined throughout the nineties I transitioned into investment grade corporate bonds to help maintain clients’ income. When corporate bond yields became lower I transitioned to preferred shares. Mirador’s fixed income allocation has been comprised of preferred shares for a number of years now.
Let me be frank, if bankruptcy occurs, no investors get much – not even the bond holders. But preferred share holders will get a payout before the stock holder. And for decades I have been able to select preferred shares of companies in good financial condition with little risk of trouble and default. The perception of preference tends to make preferred shares less volatile than stocks but the slightly higher risk gives them a better yield than bonds, and the dividends make them so much more tax efficient than an interest paying bond.
We use the yield curve, combined with credit spreads, and other factors such as the 10 year Bond Price trend, to determine allocation changes between the three components of Triopay; Equity Income Stocks, Fixed Income Preferred Shares, and Covered Call Writing. And to some degree, these factors affect the allocation to the Market Exposure system that helps with our security of capital objective by reducing volatility and drawdown.
If you have any questions or would like to discuss the current credit spread environment further please do not hesitate to reach out at 403-608-4664.
Stan Clarke
403-608-4664
Investing for Income Believer